|
|
|
|
 Print Print
|
|
|

Also by Gill.....
Turbine Balancing.
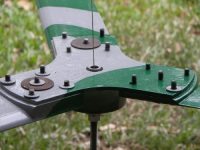
A very accurate way of balancing
your
windmill turbine. Balancing is
important to avoid tower
wobble,
bearing wear and blade failures in
high winds.
The method described
here was contributed by forum
members Gill and Klaus.
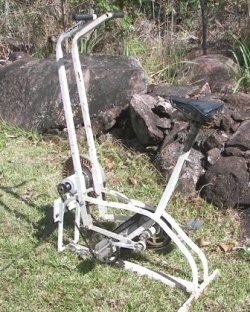
Gills compound machine.
 |
| Gills Anemometer data logger. |
Page 1 | 2 |
Gilbert ( Gill on the forums )from Cairns, Queensland Australia has put together a Aneometer with logging!
The design is based on the PicAxe chip, and shows how the PicAxe can be used with EEPROM chips (24LC256's) to increase its data memory. There are two parts to this article. First the datalogger, and then how Gill made this anemometer from spare parts.
In Gill's words....
Gill’s Anemometer
V.5.0
I have a need to assess sites for their potential as suitable for wind power generation.
The idea is to gather a week or so of wind data then compare that to the nearest recording site say like a weather station or airport. With a known general variation, the years of weather station records can be converted to site data for a quick more long term assessment.
I have an anemometer that can log wind speeds direct to a computer. There is no problem when close to existing dwellings as the logging laptop can be safe and powered from inside the house. However on more remote sites, I’m not inclined to leave my laptop unattended whilst it records data over many days. There is the power supply to be sorted if it were and besides, I need to use my laptop. To overcome these problems I felt a stand alone anemometer datalogger was needed. I decided to build one for myself. |
|
The completed unit is based on the PicAXE 18x. It stores data in 8x serial eeprom, so holds 2Mb of data. 3x 7 segment LED display gives a local display of wind speed. Data and display shows wind speed in either kph or m/s as user set. Sample time of the wind speed can be user set from 1 second up to the international standard sample time for small wind generators of 60 seconds. This sample time influences the number of days data can be collected over. To aid power conservation and extend logging duration, a very low power Sleep Mode is entered if wind speeds drop very low. Regular brief checks are made to assess if the wind has picked up during the sleep mode. During sleep mode the display is also disabled though typically this would be switched off when not attended by the user. |


 |
In operation there are 3 states of use as controlled by the main Logging switch.
- ‘Display Only’; gives a wind speed reading that is updated at the end of each sample time. A green ‘Power On’ LED flashes each second and is most accurate as coming from the clock IC. It starts flashing at power ON and stops at power OFF.
- ‘Log’; sends clock time and wind speed data to be saved on eeprom. Each time this data is logged an orange LED flashes. Logging continues until either all the eeprom are full or logging is turned OFF by the user. Cessation of logging by either cause results in the orange LED no longer flashing.
- ‘Download’; firstly, it is necessary to have the download cable connected, and the appropriate software running before downloading to the computer and saving to file. Fortunately data is only erased by overwriting so multiple downloads of the same data is possible. During the download process the red LED is ON, and the display is disabled. Display returns to the Display Only state when the download completes.
The Logger’s download of data is in ASCII format, so is suitable for programmes such as the Picaxe’s Programming Editor’s Terminal programme. Other’s Terminal programmes suit also. Simple (freeware) data logging programmes are available from Eltima, Termite, WCSC & AccessPort. The programme saves the data to a file that can be read by Microsoft Excel and from there, there are no data processing/graphing limits for you computer wizards.
|
When no sleep modes are entered, the max possible days of logging are:
| 1.5 days |
for a |
1 second wind sample |
| 4.5 days |
for a |
3 second wind sample |
| 7.5 days |
for a |
5 second wind sample |
| 15 days |
for a |
10second wind sample |
| 91 days |
for a |
60second wind sample |
It takes approx 80 minutes to download the logger when totally filled with data.
Suitable power input comes from either one of 3 sources.
- Firstly, internal 3 x AA batteries. At 1.5 volts, this gives a nominal 4.5v. Here a dummy battery is fitted into the battery holder to complete the circuit.
- Secondly, internal 4 x NiCad at 1.2volts gives a nominal 4.8volts.
- Lastly an external power source in the range of 4.5 to 5volts DC can be used. The external source disconnects the internal batteries, so unfortunately there is no recharging of NiCad’s without removing them.
Average power drain is:
75mA Logging with Display _ ON
15mA Logging with Display _ OFF
13mA Logging but in Sleep mode (auto display off)
Battery life is dependant on the wind (sleep modes), the extent of Display usage and the battery quality. I have no examples of battery life to offer at this time.
I hope this project inspires others to create versions of their own.
Cheers ………..Gill
Circuit Error. Please note there is a error in the circuit Gill has drawn up. Pins 7 and 11 of the PicAxe 18X chip are labeled incorrectly, they should be swapped around. The Veroboard component layout is correct.
|
|
Download the circuit, parts list, description and source code. |
|
|
|
|
|
|
|
© TheBackShed 2011
|