
|
|
Forum Index : Microcontroller and PC projects : MMB4L as utility program for charting
| Author | Message | ||||
| lizby Guru Joined: 17/05/2016 Location: United StatesPosts: 3817 |
I have a number of appliances which run through Sonoff POW R3 16 and 20D mains monitor devices, flashed with Tasmoto:  On a Raspberry Pi 5, I use the Tasmoto WebUI to download the "Energy Today" value every 6 minutes--in kilowatts. This gives me 240 data points per device per day. I massage it in various ways, and then use the following MMB4L program to produce an html document which displays a chart using google chart. 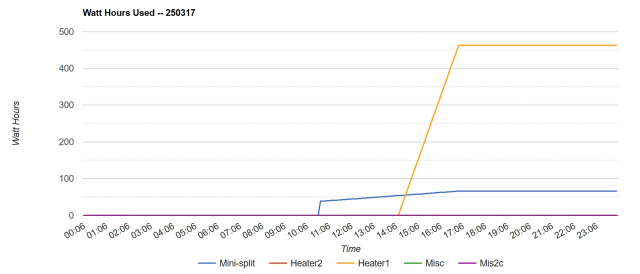 NumSets = 4 'The number of EXTRA datasets to be plotted. nSlots=24*60/6 ' 240 6-minute time slots Dim as string ar_slotTime$(nSlots) Dim as float fkwhUsed(NumSets,nSlots) ' kwh for each Sonoff device for each 6-minute timeslot Dim as float fValue!(NumSets) 'Create an array to hold the new values. Dim DataSet$(NumSets) 'Create a string array to hold each dataset. Dim DataSetLabel$(NumSets)=("Mini-Split","200W-heat","60W-light","500W-heat","Misc") ' A,B,C,D,E sMoAbbrev$="JanFebMarAprMayJunJulAugSepOctNovDec" Angle = 0 'Starting value for dummy data TimeStamp$ = "" 'Declare empty timestamp. lineNo=0 ' LB: line # of input file to read flagDone=0 ' LB: end of input file type$="kWh" ' LB otherwise, Volts voltswatts$="kWh" fn$="/home/lb/data/kwh250317.srt" 'fn$="" day$=mid$(fn$,18,6) timestampNow$="20"+mid$(fn$,18,2)+"-"+mid$(fn$,20,2)+"-"+mid$(fn$,22,2)+" 00:06:00" '6min past midnight epochSlot=epoch(timestampNow$) for slot = 0 to nSlots-1 slotTime$=datetime$(epochSlot) ar_slotTime$(slot)=mid$(slotTime$,12,2)+":"+mid$(slotTime$,15,2) epochSlot=epochSlot+360 ' 6 minutes next slot epochSlot=epoch(timestampNow$) print "Start Time: "+timestampNow$+" ";int(epochSlot) 'open fn$ for input as #1 extractData end '----------------------------------------------------------------------------------------- Sub extractData open fn$ for input as #1 line input #1, line$ recTimeStampSlot$=mid$(line$,1,12) tm$=datetime$(epochSlot) slotTime$=datetime$(epochSlot) tmStampSlotCurrent$=mid$(line$,1,6)+mid$(slotTime$,12,2)+mid$(slotTime$,15,2)+mid$(slotTime$,18,2) print "1 "+tmStampSlotCurrent$+" "+recTimeStampSlot$ print nLines;" "+line$ itemNo=1 slot=0 do while line$ <> "" nLines=nLines+1 do while tmStampSlotCurrent$<recTimeStampSlot$ for i=0 to NumSets-1: fkwhUsed(i,slot)=0: next slot=slot+1 epochSlot=epochSlot+360 ' 6 minutes slotTime$=datetime$(epochSlot) slot_hhmmss$=mid$(slotTime$,12,2)+mid$(slotTime$,15,2)+mid$(slotTime$,18,2) ' ar_slotTime$(slot)=slot_hhmmss$ tmStampSlotCurrent$=mid$(line$,1,6)+slot_hhmmss$ 'print "2 "+tmStampSlotCurrent$+" "+recTimeStampSlot$+" "+str$(fkwhUsed(0,slot-1))+" "+str$(fkwhUsed(1,slot-1))+" "+str$(fkwhUsed(2,slot-1)) loop i=asc(mid$(line$,14,1))-asc("A") ' A,B,C<D,E -> 0-4 if i >= 0 and i <= NumSets then fkwhUsed(i,slot)=val(mid$(line$,16)) endif line input #1, line$ nLines=nLines+1 'print nLines;" "+line$ recTimeStampSlot$=mid$(line$,1,12) if tmStampSlotCurrent$<recTimeStampSlot$ then slot=slot+1 epochSlot=epochSlot+360 ' 6 minutes slotTime$=datetime$(epochSlot) slot_hhmmss$=mid$(slotTime$,12,2)+mid$(slotTime$,15,2)+mid$(slotTime$,18,2) ' ar_slotTime$(slot)=slot_hhmmss$ tmStampSlotCurrent$=mid$(line$,1,6)+slot_hhmmss$ 'print "3 "+tmStampSlotCurrent$+" "+recTimeStampSlot$+" "+str$(fkwhUsed(0,slot-1))+" "+str$(fkwhUsed(1,slot-1))+" "+str$(fkwhUsed(2,slot-1)) endif ' if nLines>20 then exit do loop close #1 slotTime$="000600" tmStampSlotCurrent$=mid$(fn$,18,6)+slotTime$ ' starting time slot slot = 0 fn2$="/home/lb/kwh/kwhs"+mid$(fn$,18,6)+".slot" open fn2$ for output as #1 for i=0 to nSlots-1 aa$="" for j=0 to NumSets-1: aa$=aa$+" "+str$(fkwhUsed(j,slot)): next print #1, tmStampSlotCurrent$+aa$ slot=slot+1 slotTime$=str$(val(slotTime$)+600) tmStampSlotCurrent$=mid$(tmStampSlotCurrent$,1,6)+slotTime$ next close #1 print fn2$+" written; ";nLines;" read" on error skip system "rm /home/lb/charts/a_"+day$+"D.html" cmd$="cp /home/lb/charts/_kwhday.start /home/lb/charts/a_"+day$+"D.html" system cmd$ open "/home/lb/charts/a_"+day$+"D.html" for append as #1 for slot = 0 to nSlots-1 ' [ '00:00',21,18,22,21,7,0,7,19 ], ' [ '00:10',21,18,22,21,7,0,7,19 ], a$="[ '"+mid$(ar_slotTime$(slot),1,5)+"'" for j=0 to NumSets if slot > 0 then if fkwhUsed(j,slot) < fkwhUsed(j,slot-1) then ' if data absent fkwhUsed(j,slot) = fkwhUsed(j,slot-1) endif endif wattsUsed$=str$(fkwhUsed(j,slot)*1000) a$=a$+","+wattsUsed$ next j a$=a$+" ]," print #1,a$ next slot print #1,"]);" print #1,"" print #1,"// Set Options" print #1,"const options = {" print #1," title: 'Watt Hours Used -- "+day$+"'," close #1 cmd$="cat /home/lb/charts/_kwhday.end >> /home/lb/charts/a_"+day$+"D.html" system cmd$ cmd$="sudo cp /home/lb/charts/a_"+day$+"D.html /var/www/html" system cmd$ print "/home/lb/charts/a_"+day$+"D.html written" End Sub ' extractData '----------------------------------------------------------------------------------------- The program processes the input and fills an array with the cumulative kilowatt values for each device for each of the 240 time slots. The program shells out to copy a standard header file to the output, then generates the data records for each time slot, and then shells out again to append a trailer file. Finally the output is copied to /var/www/html, from which web pages are served. Then any device on my network can retrieve it. For this instance, I only have 2 devices running for part of the day. (My real application is for when I return to Canada in a little over a month.). Here's the standard header file: !DOCTYPE html> <html> <script src="https://www.gstatic.com/charts/loader.js"></script> <body> <div id="myChart" style="width:100%; max-width:1600px; height:500px;"></div> <script> google.charts.load('current',{packages:['corechart']}); google.charts.setOnLoadCallback(drawChart); function drawChart() { // Set Data const data = google.visualization.arrayToDataTable([ ['Time','Mini-split','Heater2','Heater1','Misc','Mis2c'], And the trailer file: hAxis: {title: 'Time'}, vAxis: {title: 'Watt Hours'}, legend: { position: 'bottom' } }; // Draw const chart = new google.visualization.LineChart(document.getElementById('myChart')); chart.draw(data, options); } </script> </body> </html> I apologize that I don't have a better example. I'm very glad to have MMB4L to write this kind of program, so I don't have to phaff about with PHP or LUA or some other language which I use very infrequently. I'm sure this will continue to evolve as I get more devices working. PicoMite, Armmite F4, SensorKits, MMBasic Hardware, Games, etc. on FOTS |
||||
| Volhout Guru Joined: 05/03/2018 Location: NetherlandsPosts: 5994 |
Hi Lizby, Thanks for this code. I currently have not matching application, but I can use this as an example of how it can be done. It will come on my path one day... Volhout PicomiteVGA PETSCII ROBOTS |
||||
| thwill Guru Joined: 16/09/2019 Location: United KingdomPosts: 4378 |
Thanks for sharing Lance, I'm glad to hear you are finding it useful. Best wishes, Tom MMBasic for Linux, Game*Mite, CMM2 Welcome Tape, Creaky old text adventures |
||||
| lizby Guru Joined: 17/05/2016 Location: United StatesPosts: 3817 |
Here is how I used the Tasmoto WebUI to gather the data. From the Linux command line: curl -s 'http://192.168.1.31/cm?cmnd=Status%208' Returns this JSON string: {"StatusSNS":{"Time":"2025-03-24T12:08:48","ENERGY":{"TotalStartTime":"2025-01-24T15:09:38","Total":269.066,"Yesterday":5.022,"Today":1.158, "Power":10,"ApparentPower":13,"ReactivePower":7,"Factor":0.82,"Voltage":122,"Current":0.104}}} I only need the "Today" values, which is in cumulative kilowatts. There's a Linux JSON parser, jq, so on the Raspberry Pi "sudo apt update && sudo apt install jq" makes it available. Then, for my various devices (5 in this example), this gets the current data for each device: kWh=$(curl -s 'http://192.168.1.31/cm?cmnd=Status%208' | jq -r '.StatusSNS.ENERGY.Today') echo "$(date +%y%m%d%H%M%S) A $kWh" >> /home/lb/kwh-31 kWh=$(curl -s 'http://192.168.1.181/cm?cmnd=Status%208' | jq -r '.StatusSNS.ENERGY.Today') echo "$(date +%y%m%d%H%M%S) B $kWh" >> /home/lb/kwh-181 kWh=$(curl -s 'http://192.168.1.182/cm?cmnd=Status%208' | jq -r '.StatusSNS.ENERGY.Today') echo "$(date +%y%m%d%H%M%S) C $kWh" >> /home/lb/kwh-182 kWh=$(curl -s 'http://192.168.1.183/cm?cmnd=Status%208' | jq -r '.StatusSNS.ENERGY.Today') echo "$(date +%y%m%d%H%M%S) D $kWh" >> /home/lb/kwh-183 kWh=$(curl -s 'http://192.168.1.184/cm?cmnd=Status%208' | jq -r '.StatusSNS.ENERGY.Today') echo "$(date +%y%m%d%H%M%S) E $kWh" >> /home/lb/kwh-184 The fully qualified JSON name is .StatusSNS.ENERGY.Today. I have a cron job which runs this every 6 minutes. The "A", "B", etc. provide an identifier for the record to show which device the kWh reading has come from. Then at 11:59pm, another chron job runs, chart.sh: /bin/grep "$(date +%y%m%d)" /home/lb/kwh-31 > /home/lb/today.txt /bin/grep "$(date +%y%m%d)" /home/lb/kwh-182 >> /home/lb/today.txt /bin/grep "$(date +%y%m%d)" /home/lb/kwh-183 >> /home/lb/today.txt /bin/grep "$(date +%y%m%d)" /home/lb/kwh-184 >> /home/lb/today.txt sort /home/lb/today.txt > /home/lb/data/kwh$(date +%y%m%d).srt This extracts the records for today's date for (at present) 4 Sonoff devices and sorts them by time and device ID. Then the MMB4L program can be run against the daily file. This version charts the rising accumulated watt usage. The next variation will chart the amount for each device for each 6-minute period--more ups and downs. ~ Edited 2025-03-25 02:33 by lizby PicoMite, Armmite F4, SensorKits, MMBasic Hardware, Games, etc. on FOTS |
||||
| lizby Guru Joined: 17/05/2016 Location: United StatesPosts: 3817 |
Here's the chart for kW per 6-minute period per device--in this case a 12000BTU heat pump (not having to provide much heat on a March Florida morning, and not much again in the evening) and a 200W electric heater: 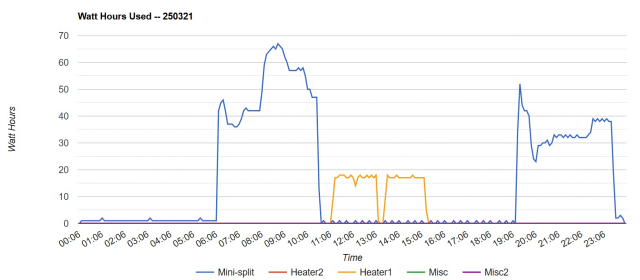 To run this I took advantage of the options Tom provided for MMB4L to be invoked with parameters, so this runs the program: mmbasic chartkwh.bas 250321 slot The arguments tell it the date (250321) and to use the number of kilowatt hours used in each 6-minute "slot". (If slot is omitted, the chart will show always-rising lines of accumulated usage over time.) Here's the program: NumSets = 4 'The number of EXTRA datasets to be plotted. nSlots=24*60/6 ' 240 6-minute time slots Dim as string ar_slotTime$(nSlots) Dim as float fkwhUsed(NumSets,nSlots) ' kwh for each Sonoff device for each 6-minute timeslot Dim as float fUsed!(NumSets), fTotal!(NumSets) Dim as float fValue!(NumSets) 'Create an array to hold the new values. Dim DataSet$(NumSets) 'Create a string array to hold each dataset. Dim DataSetLabel$(NumSets)=("Mini-Split","200W-heat","60W-light","500W-heat","Misc") ' A,B,C,D,E sMoAbbrev$="JanFebMarAprMayJunJulAugSepOctNovDec" Angle = 0 'Starting value for dummy data TimeStamp$ = "" 'Declare empty timestamp. lineNo=0 ' LB: line # of input file to read flagDone=0 ' LB: end of input file type$="kWh" ' LB otherwise, Volts voltswatts$="kWh" chartDate$=field$(mm.cmdline$,1," ") ' " " is delimiter chartType$=field$(mm.cmdline$,2," ") ' "" or "slot" if chartDate$<>"" then day$=chartDate$ else day$=mid$(date$,9,2)+mid$(date$,4,2)+mid$(date$,1,2) endif ' fn$="/home/lb/data/kwh250317.srt" fn$="/home/lb/data/kwh"+day$+".srt" 'fn$="" ' day$=mid$(fn$,18,6) timestampNow$="20"+mid$(fn$,18,2)+"-"+mid$(fn$,20,2)+"-"+mid$(fn$,22,2)+" 00:06:00" '6min past midnight epochSlot=epoch(timestampNow$) for slot = 0 to nSlots-1 slotTime$=datetime$(epochSlot) ar_slotTime$(slot)=mid$(slotTime$,12,2)+":"+mid$(slotTime$,15,2) ' hh:mm epochSlot=epochSlot+360 ' 6 minutes next slot ar_slotTime$(nSlots-1)="23:59" ' instead of "00:00" epochSlot=epoch(timestampNow$) print "Start Time: "+timestampNow$+" ";int(epochSlot) 'open fn$ for input as #1 flagDebug=0 ' if >0, maybe print some debugging information extractData end '----------------------------------------------------------------------------------------- Sub extractData open fn$ for input as #1 line input #1, line$ recTimeStampSlot$=mid$(line$,1,12) tm$=datetime$(epochSlot) slotTime$=datetime$(epochSlot) tmStampSlotCurrent$=mid$(line$,1,6)+mid$(slotTime$,12,2)+mid$(slotTime$,15,2)+mid$(slotTime$,18,2) print "1 "+tmStampSlotCurrent$+" "+recTimeStampSlot$ print nLines;" "+line$ itemNo=1 slot=0 do while line$ <> "" nLines=nLines+1 do while tmStampSlotCurrent$<recTimeStampSlot$ for i=0 to NumSets-1: fkwhUsed(i,slot)=0: next slot=slot+1 if slot > (nSlots-1) then exit do epochSlot=epochSlot+360 ' 6 minutes slotTime$=datetime$(epochSlot) slot_hhmmss$=mid$(slotTime$,12,2)+mid$(slotTime$,15,2)+mid$(slotTime$,18,2) ' ar_slotTime$(slot)=slot_hhmmss$ tmStampSlotCurrent$=mid$(line$,1,6)+slot_hhmmss$ 'print "2 "+tmStampSlotCurrent$+" "+recTimeStampSlot$+" "+str$(fkwhUsed(0,slot-1))+" "+str$(fkwhUsed(1,slot-1))+" "+str$(fkwhUsed(2,slot-1)) loop i=asc(mid$(line$,14,1))-asc("A") ' A,B,C<D,E -> 0-4 if i >= 0 and i <= NumSets then fkwhUsed(i,slot)=val(mid$(line$,16)) endif line input #1, line$ nLines=nLines+1 recTimeStampSlot$=mid$(line$,1,12) if flagDebug>0 and mid$(slotTime$,12,5) > "10:54" then print slot,slotTime$,nLines;" "+line$,tmStampSlotCurrent$,recTimeStampSlot$,"any key to continue" do while inkey$="": loop endif if tmStampSlotCurrent$<recTimeStampSlot$ then slot=slot+1 if slot > (nSlots-1) then exit do epochSlot=epochSlot+360 ' 6 minutes slotTime$=datetime$(epochSlot) slot_hhmmss$=mid$(slotTime$,12,2)+mid$(slotTime$,15,2)+mid$(slotTime$,18,2) ' ar_slotTime$(slot)=slot_hhmmss$ tmStampSlotCurrent$=mid$(line$,1,6)+slot_hhmmss$ 'print "3 "+tmStampSlotCurrent$+" "+recTimeStampSlot$+" "+str$(fkwhUsed(0,slot-1))+" "+str$(fkwhUsed(1,slot-1))+" "+str$(fkwhUsed(2,slot-1)) endif ' if nLines>20 then exit do loop close #1 slotTime$="000600" tmStampSlotCurrent$=mid$(fn$,18,6)+slotTime$ ' starting time slot slot = 0 fn2$="/home/lb/kwh/kwhs"+mid$(fn$,18,6)+".slot" open fn2$ for output as #1 for i=0 to nSlots-1 aa$="" for j=0 to NumSets-1: aa$=aa$+" "+str$(fkwhUsed(j,slot)): next print #1, tmStampSlotCurrent$+aa$ slot=slot+1 slotTime$=str$(val(slotTime$)+600) tmStampSlotCurrent$=mid$(tmStampSlotCurrent$,1,6)+slotTime$ next close #1 print fn2$+" written; ";nLines;" read" if chartType$="slot" then chartID$="E" else chartID$="D" fn$="/home/lb/charts/a_"+day$+chartID$+".html" on error skip system "rm "+fn$ cmd$="cp /home/lb/charts/_kwhday.start "+fn$ system cmd$ open fn$ for append as #1 for j=0 to NumSets fTotal!(j)=0 fUsed!(j)=0 next j for slot = 0 to nSlots-1 ' [ '00:00',21,18,22,21,7,0,7,19 ], ' [ '00:10',21,18,22,21,7,0,7,19 ], a$="[ '"+mid$(ar_slotTime$(slot),1,5)+"'" for j=0 to NumSets if slot > 0 then if chartType$="slot" then ' kwh per 6-minute time slot if fkwhUsed(j,slot) > fTotal!(j) then ' if watts consumed fTotal!(j)=fkwhUsed(j,slot) fUsed!(j)=fTotal!(j)-fkwhUsed(j,slot-1) else fUsed!(j)=0 endif else ' cumulative kwh if fkwhUsed(j,slot) < fkwhUsed(j,slot-1) then ' if data absent fkwhUsed(j,slot) = fkwhUsed(j,slot-1) endif endif endif if chartType$="slot" then wattsUsed$=str$(fUsed!(j)*1000) else wattsUsed$=str$(fkwhUsed(j,slot)*1000) endif a$=a$+","+wattsUsed$ next j a$=a$+" ]," print #1,a$ next slot print #1,"]);" print #1,"" print #1,"// Set Options" print #1,"const options = {" print #1," title: 'Watt Hours Used -- "+day$+"'," close #1 cmd$="cat /home/lb/charts/_kwhday.end >> "+fn$ system cmd$ cmd$="sudo cp "+fn$+" /var/www/html" system cmd$ print fn$+" written" End Sub ' extractData '----------------------------------------------------------------------------------------- The tiny pointed blips ("^") on the blue line show the mini-split using only about 1 watt hour every 2 hours with the temperature turned down overnight, and then during the day when no heat was called for, but with the temperature set higher, about once every 18-24 minutes. This is of course a level usage, and the blips only show when the JSON variable "Today" (cumulative kilowatt hours) increases by 1 since the previous 6-minute time slot. ~ Edited 2025-03-26 08:10 by lizby PicoMite, Armmite F4, SensorKits, MMBasic Hardware, Games, etc. on FOTS |
||||
| The Back Shed's forum code is written, and hosted, in Australia. | © JAQ Software 2026 |
